SOUTH AUSTRALIA
HOW HAVE PERSONAL CRIME VICTIMISATION RATES CHANGED OVER TIME?
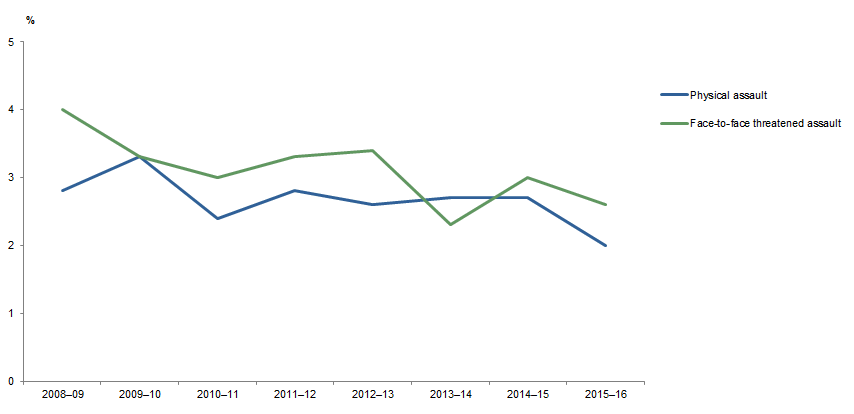
No fitted functions that met the inclusion criteria were identified for physical assault or face-to-face threatened assault in South Australia.
VICTIMISATION RATES, Selected personal crimes, South Australia, 2008–09 to 2015–16(a)

Australian Bureau of Statistics
© Commonwealth of Australia 2017.
Footnote(s): (a) Data for non face-to-face threatened assault are not shown, as estimates for the number of persons experiencing non face-to-face threatened assault in the 12 months prior to interview are subject to high sampling error (for further details refer to the Technical Note).
Source(s): Crime Victimisation, Australia
HOW HAVE HOUSEHOLD CRIME VICTIMISATION RATES CHANGED OVER TIME?
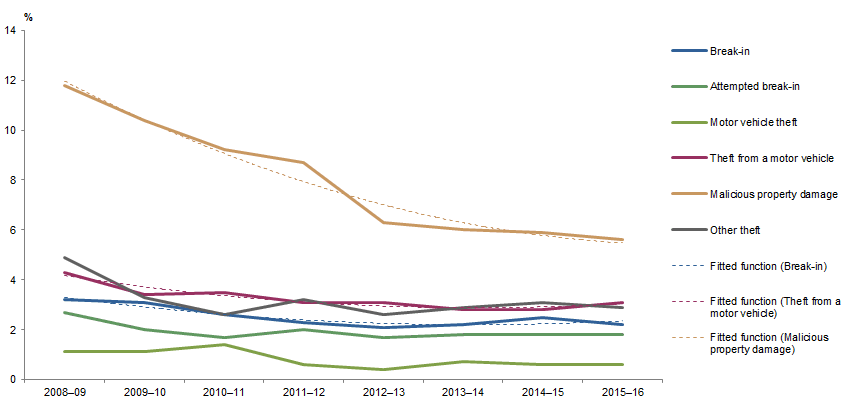
The fitted function analysis showed a decline in the victimisation rate for malicious property damage in South Australia since 2008–09. Victimisation rates for break-in and theft from a motor vehicle have generally declined, although these have now plateaued. No fitted functions that met the inclusion criteria were identified for attempted break-in, motor vehicle theft or other theft.
VICTIMISATION RATES, Selected household crimes, South Australia, 2008–09 to 2015–16(a)(b)

Australian Bureau of Statistics
© Commonwealth of Australia 2017.
Footnote(s): (a) The fitted functions used to analyse patterns of change in victimisation rates over time have not taken into account the survey error associated with the annual victimisation rates. This is expected to have limited impact on the analysis, as only survey estimates with RSEs of 15% or less were included in the analysis. For further information on survey error refer to the Technical Note. (b) Fitted functions are: break-in is a polynomial function with equation y = 0.0417x2 - 0.5107x + 3.7607 R2 = 0.8625; theft from a motor vehicle is a polynomial function with equation y = 0.0482x2 - 0.5946x + 4.7089 R2 = 0.8894; malicious property damage is a polynomial function with equation y = 0.1042x2 - 1.8649x + 13.723 R2 = 0.9682.
Source(s): Crime Victimisation, Australia
 Print Page
 Print All
 Quality Declaration